A campaign is finished and you have a spreadsheet. The temptation is to read every number at once and conclude something vague about messaging.
Read three numbers, in order. Each one points at a different fix, and reading them out of order is why teams rewrite copy to solve targeting problems.
1. Acceptance rate
What it tells you: whether these were the right people.
| Rate | Reading |
|---|---|
| Above 30% | List is good. Move on to the next number |
| 20 to 30% | Workable. Tighten the audience next round |
| Below 20% | Wrong audience. Stop and rebuild |
The bands sit around the average. Belkins’ 2025 LinkedIn outreach study puts the average connection acceptance rate at 26%. Above 30% beats that average, and below 20% is well under it.
Nothing below this line matters if acceptance is under 20%, and no rewrite of the connection note will move it. The people had no visible reason to accept.
It is also the risk number. LinkedIn lists invitations that are ignored, left pending or marked as spam as one of two reasons it restricts an account from sending invitations, so a low-acceptance campaign is expensive twice.
2. Reply rate
What it tells you: whether the message worked, given that the list was right.
Only read this when acceptance cleared 30%. Otherwise you are measuring copy against an audience that was never going to engage.
Thin replies on a well-accepted list means the opener is not landing. Usually it is one of three things: it opens with you rather than them, it asks for a meeting too early, or it could have been sent to anyone.
3. Positive reply rate
What it tells you: whether the offer is right.
Plenty of replies but all of them polite declines is the most expensive result to get and the most useful. The targeting worked, the message worked, and the thing you are offering is not what these people want.
That is a positioning finding, not a campaign finding, and it is worth more than the meetings you did not book.
Read the declines properly
Sort the negative replies into buckets:
- “Not right now” means timing, so recycle them in a quarter
- “We already use X” means competitor displacement, a different message
- “Not my area” means a targeting miss, check the filter
- “Not interested” with no elaboration usually means the message did not land
The distribution tells you more than the count.
Where the numbers live
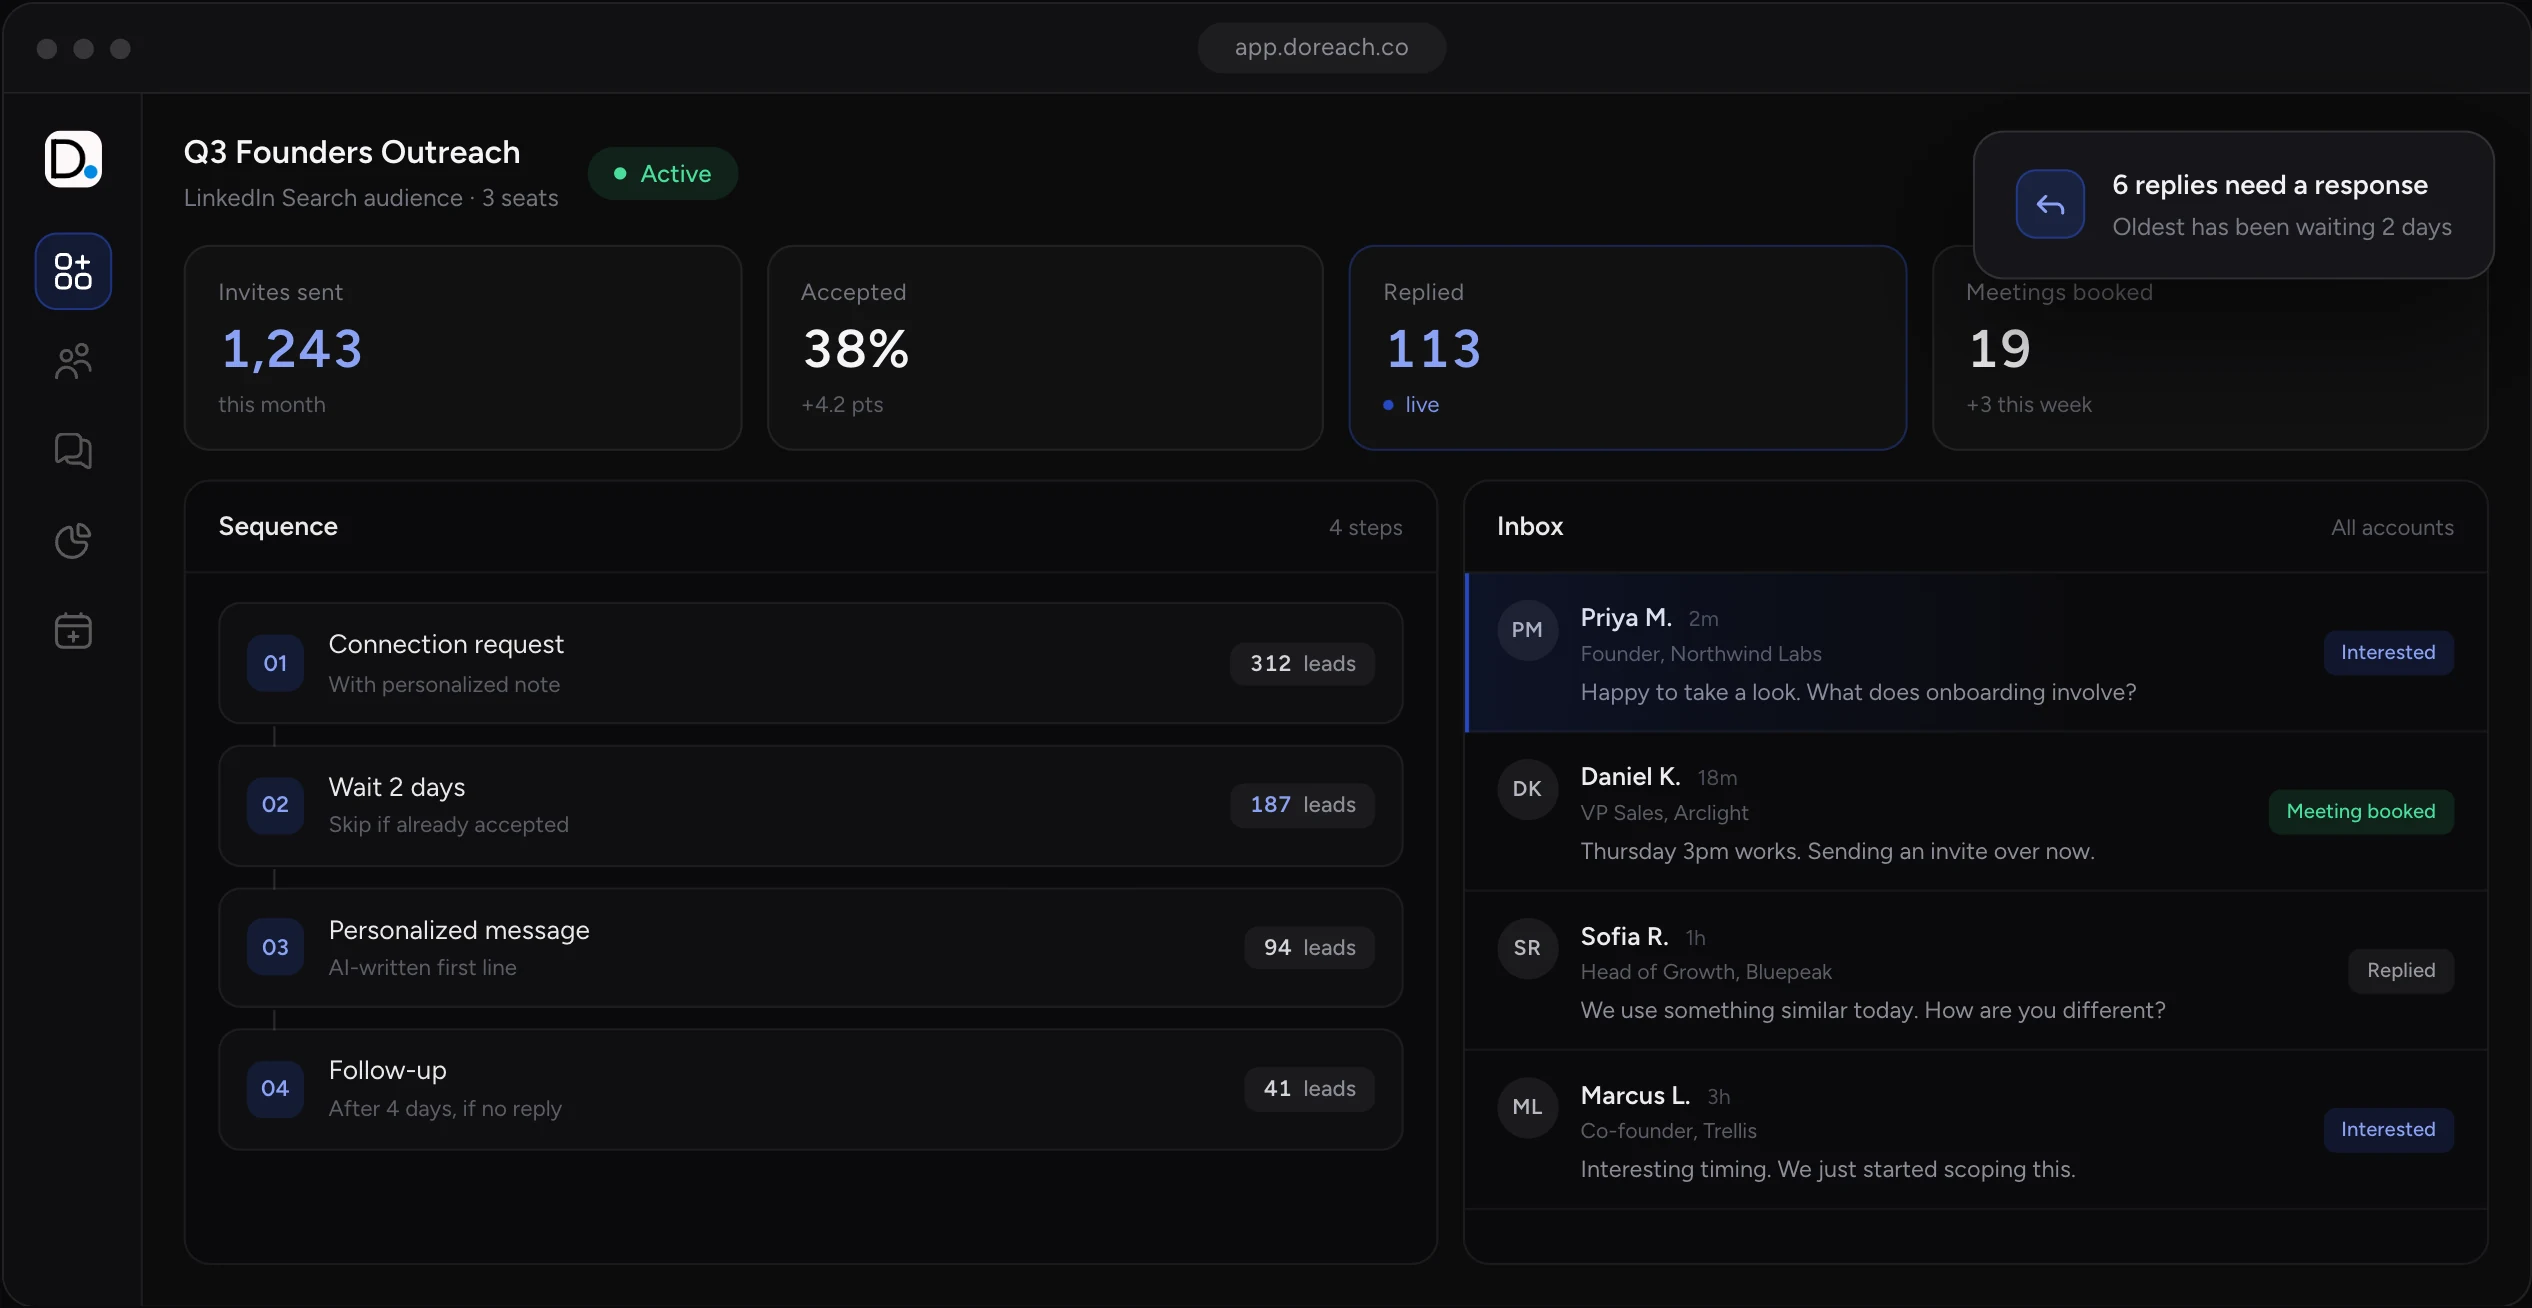
Doreach reports enrolled contacts, replies and meetings for each campaign, and invitations sent and accepted for each channel and account, so these numbers are visible without exporting anything. Analytics and reporting covers what is tracked.
The useful habit is comparing two campaigns on the same axis rather than reading one in isolation. A 24% acceptance rate means nothing until you have seen your own 38%.
What to do next
Take your last completed campaign and write down the three numbers. Whichever is the first to fall below its threshold is the only thing worth changing next round.